
- Bitcoin price closes below its lower consolidation limit at $116,000, signaling a correction as bearish pressure intensifies.
- Ethereum price slips below key support, hinting at a pullback toward the $3,500 psychological level.
- Ripple’s XRP holds above its key support at $2.99, a firm close below would lead to a decline to $2.78.
Bitcoin (BTC), Ethereum (ETH), and Ripple (XRP) price action are showing signs of weakness as bears gain control of the momentum. BTC and ETH close below their key support levels, while XRP hovers around a critical level, all hinting at potential downside moves in the near term.
Bitcoin is set for correction below 16-day range
Bitcoin price finally broke below its lower consolidation level at $116,000 on Thursday, ending a 16-day consolidation phase and signaling a potential shift in market momentum. At the time of writing on Friday, it hovers at around $115,800.
If BTC continues its pullback, it could extend the decline to retest the 50-day Exponential Moving Average (EMA) at $112,961.
The Relative Strength Index (RSI) on the daily chart is slipping below its neutral level of 50 and points downward, indicating that bearish momentum is gaining traction. The Moving Average Convergence Divergence (MACD) showed a bearish crossover on July 23, giving sell signals. It also shows a rising red histogram bar below its neutral line, suggesting further bearish momentum and a downward trend.
BTC/USDT daily chart
However, if BTC recovers, it could extend the recovery toward its upper boundary of the consolidation range at $120,000.
Ethereum bears aiming for $3,500 mark
Ethereum price declined nearly 3% on Thursday, closing below its daily support level of $3,730. At the time of writing on Friday, it hovers at around $3,700.
If ETH continues its pullback, it could extend the decline to the next support at $3,500.
The RSI momentum indicator on the daily chart slips below its overbought level and points downward, indicating fading bullish momentum. The MACD indicator on the daily chart also showed a bearish crossover on Wednesday, further supporting the bearish thesis and downward trend on the horizon.
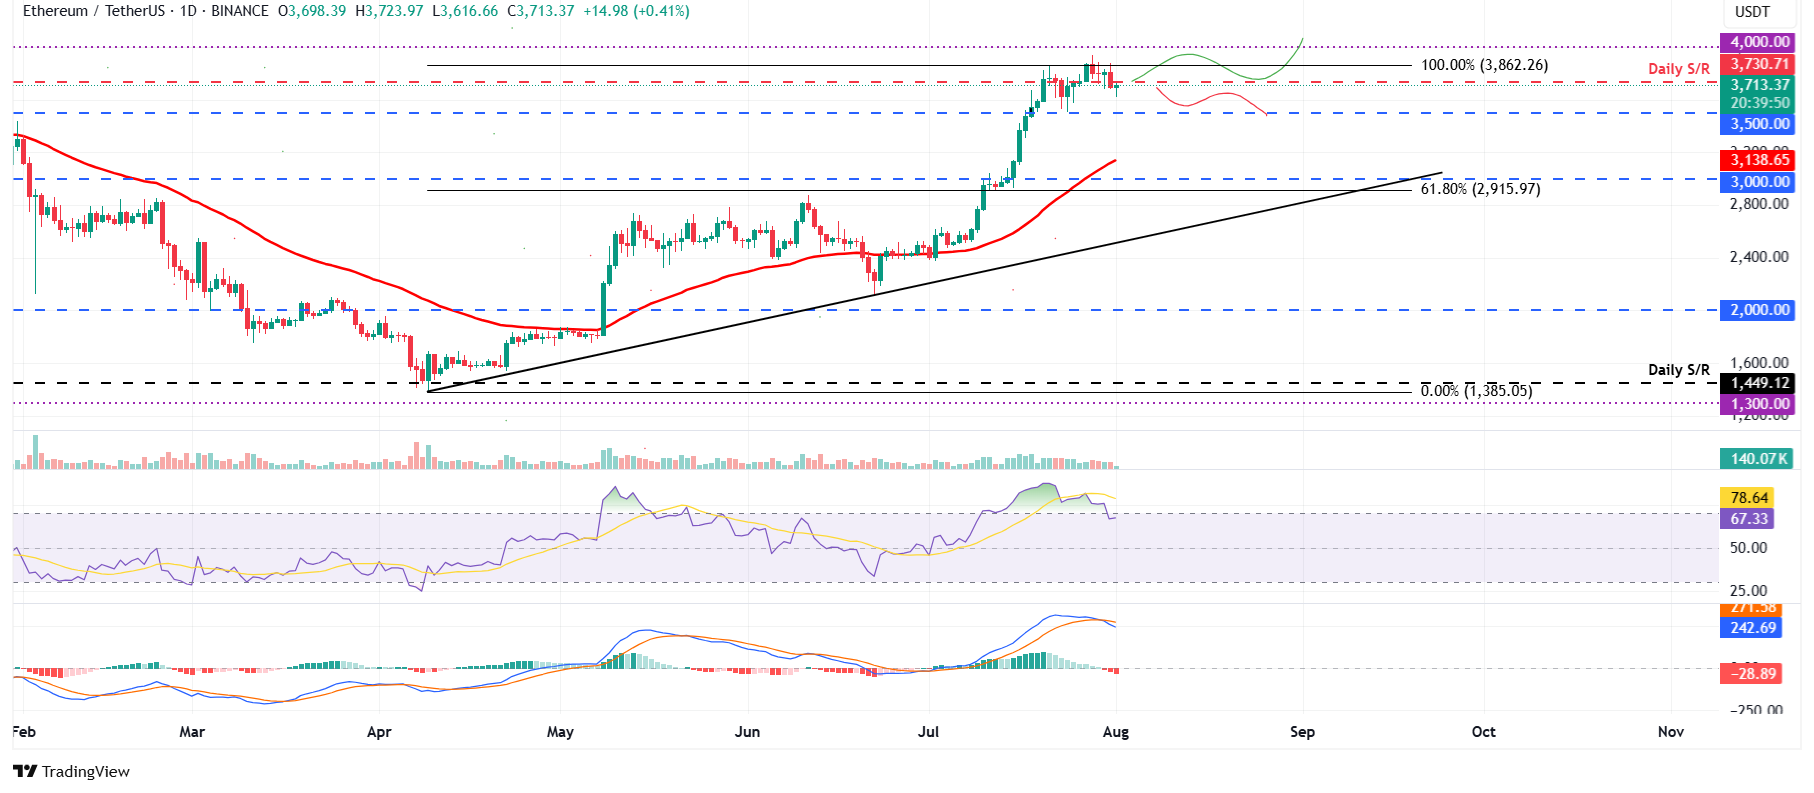
ETH/USDT daily chart
On the other hand, if ETH recovers, it could extend the recovery toward its key psychological level at $4,000.
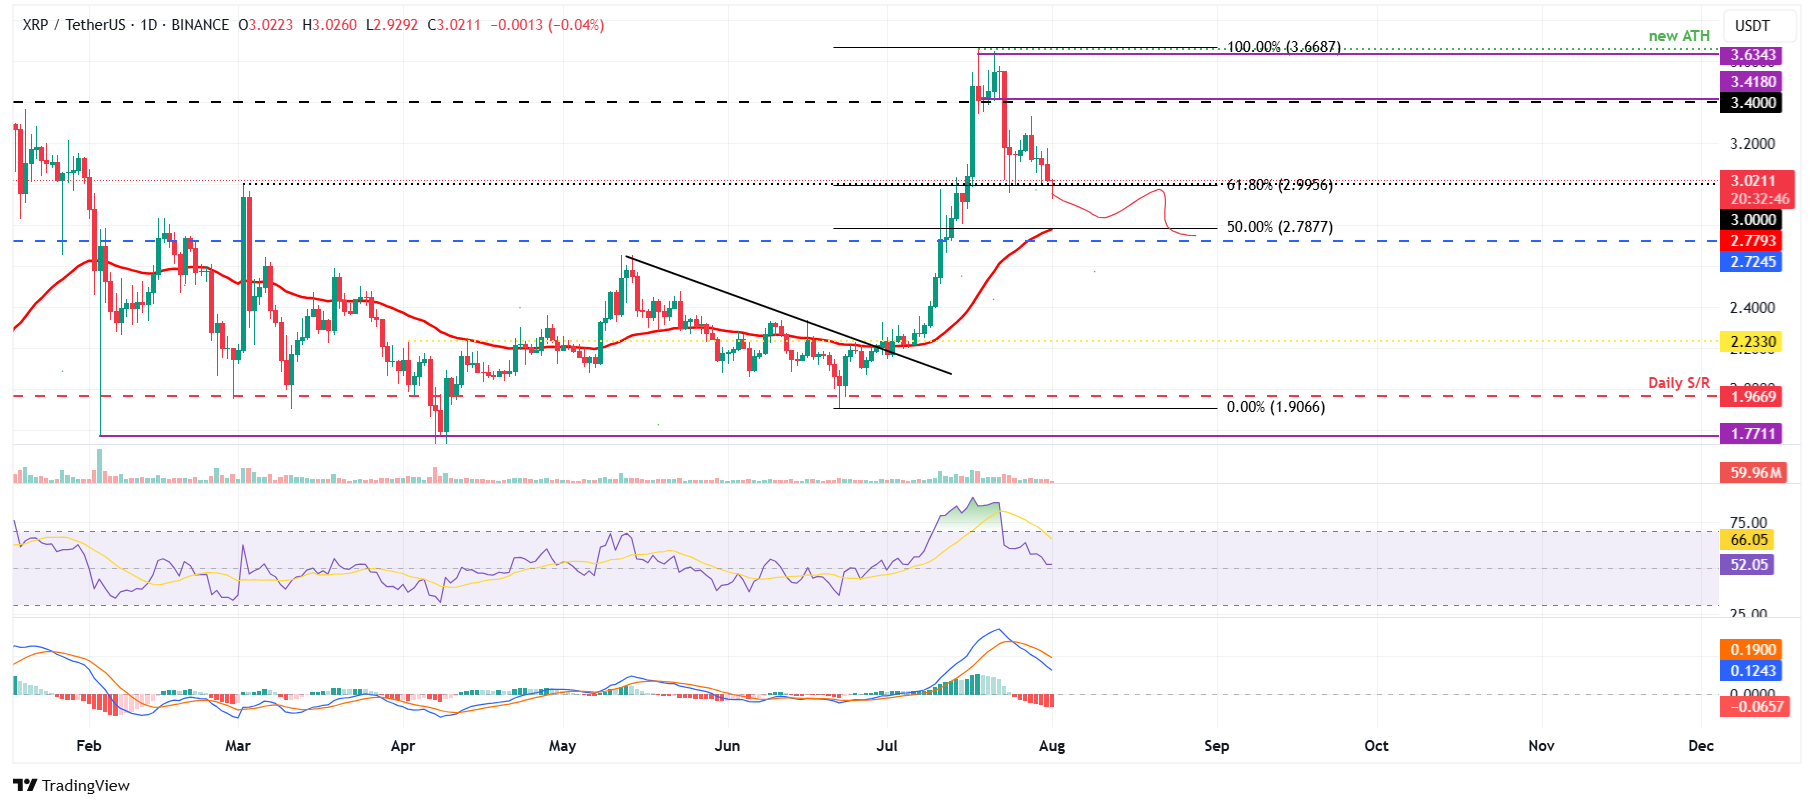
XRP could decline if it closes below $2.99 support level
XRP price broke below the daily support level at $3.40 on July 23 and declined by 11% the following day. However, it retested and found support around its 61.8% Fibonacci retracement at $2.99 on Friday, rebounding 3.43% during the weekend. At the start of the week on Monday, XRP continued its correction and declined 6.43% until Thursday. At the time of writing, it hovers around $3, finding support around $2.99 level.
If XRP closes below $2.99, it could extend the decline toward its next daily support level at $2.72.
Like Bitcoin, XRP’s RSI is showing signs of fading bearish momentum, and the MACD indicator is also supporting the bearish thesis, suggesting a correction ahead.
XRP/USDT daily chart
Conversely, if the support at $2.99 remains strong, XRP could continue its recovery toward its previous broken support at $3.40.